
 Insurance Nerds
This guest article is from David Delaney, President & CEO, at Insight Analytics.
The storm that redefined "Northeast risk" wasn't even a hurricane when it made landfall. The losses were still no surprise to the models.
On the evening of October 29, 2012, the storm center came ashore near Brigantine, New Jersey, with 70-knot winds and a 945 mb pressure. By then the National Hurricane Center had already reclassified it: Sandy made landfall as Post-Tropical Cyclone Sandy, not a hurricane (NHC Tropical Cyclone Report). That technicality is why most of the industry still calls it Superstorm Sandy, and it mattered more than a label. It helped trigger a real fight over percentage hurricane deductibles that were written to activate on "hurricane," not "post-tropical cyclone" conditions.
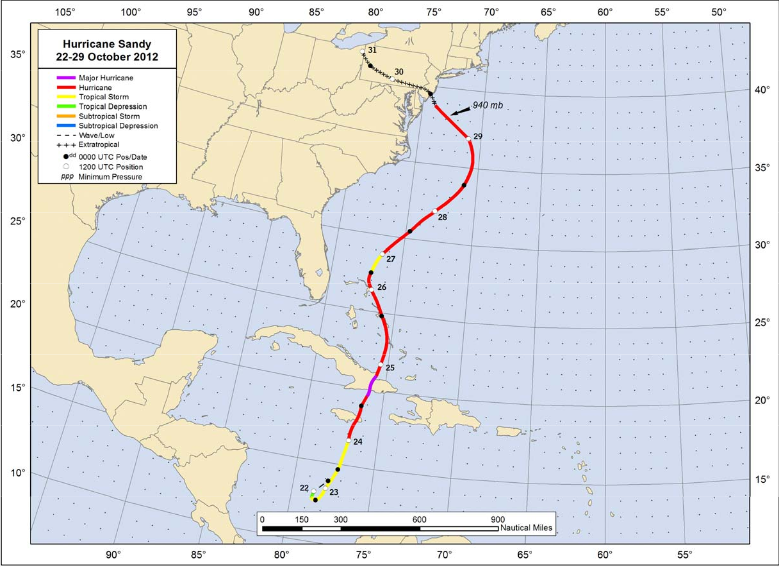
The track itself was the rare part. A blocking ridge over Greenland shut off Sandy's exit route to the open Atlantic, the path nearly every storm takes once it reaches that latitude. Instead it bent west, merged with an approaching winter trough, and drove surge into the most densely insured coastline in the country.
The track made headlines. The losses did not break new ground.
Hurricane Sandy's track, October 22-29, 2012, from the National Hurricane Center's Tropical Cyclone Report. Image: NOAA/National Hurricane Center.
What it cost in 2012
Total economic damage came in at $65.0 billion in 2012 dollars by NOAA's National Centers for Environmental Information, the federal government's official tally ($88.5 billion adjusted to 2024 dollars; NOAA retired this database in 2025, so the figure is now final) (NOAA NCEI). Swiss Re put total damage closer to $70 billion (Swiss Re, 2012 natural catastrophe report).
Private insurers, excluding the National Flood Insurance Program, paid out $18.75 billion according to Property Claim Services, the industry's official loss-count source, making Sandy the third-costliest insured disaster in U.S. history at the time, behind Katrina and Andrew (Triple-I). That figure came from 1.52 million claims. Commercial claims were just 13% of that count but 48% of the dollars, $9.02 billion; homeowners claims were $7.0 billion; auto was $2.73 billion (Triple-I / Munich Re, PCS data). New York carried about $9.6 billion of the private total, New Jersey about $6.3 billion.
The NFIP paid separately: $8.967 billion on 132,800 paid losses (Triple-I, FEMA data). Add that to the private total and total insured losses land around $28 billion, in the range of Munich Re's own figure of $30.15 billion insured, inclusive of NFIP, in original values (Munich Re).
Wind vs. flood. There's no single official split, but every serious source agrees flood did most of the damage. Swiss Re found residential losses roughly evenly split between wind and flood, but on the commercial side 65-70% of insured losses came from flood; counting NFIP, less than half of total insured loss was wind-related (Swiss Re). RMS put it similarly: $14 billion of its $25 billion private-market estimate for commercial lines was surge, versus $2 billion wind; residential ran the other way, $7 billion wind to $1 billion surge, for a blended private-market split of roughly 60% surge (Artemis). Crawford & Company and other adjusters cite the same rough 65% surge figure (Crawford).
New York's subway system flooded for the first time in its history. Lower Manhattan went dark. Coastal New Jersey lost entire blocks of housing stock to surge, not wind.
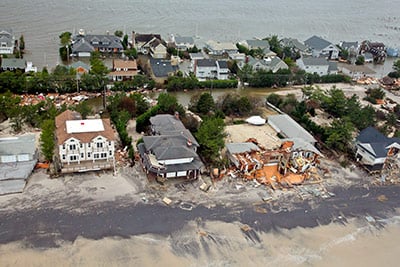
Aerial view of beachfront homes destroyed by Hurricane Sandy's storm surge, New Jersey coast, October 30, 2012. Photo: U.S. Air Force, Master Sgt. Mark C. Olsen.
The human cost. The NHC's official count is 147 direct deaths across the Atlantic basin: 72 in the U.S., 54 in Haiti, 11 in Cuba, and smaller numbers elsewhere. At least 87 more Americans died indirectly, about 50 of them from cold exposure during post-storm power outages (NHC Tropical Cyclone Report). NOAA's combined U.S. figure, direct plus indirect, is 159. In the U.S., 57% of direct deaths were attributed to storm surge, not wind.
The real lesson isn't about the track
Here's the conclusion that matters most to anyone who models this business: final insured-loss estimates from the major catastrophe modelers, RMS, AIR, Eqecat, and Impact Forecasting, averaged $18.8 billion, essentially identical to the $18.75 billion PCS actually recorded (practitioner compilation, Stephen Mildenhall). The models were not wrong about how much a storm like this would cost.
What they hadn't produced, before the fact, was this specific track: a tropical system transitioning to post-tropical and taking a hard left into New Jersey while merging with a winter storm. That's a meteorological detail, not a loss-estimation failure. A catastrophe model's job isn't to predict the next storm's exact path. It's to estimate the frequency and severity of loss across thousands of physically plausible events, including ones the historical record hasn't produced yet. Sandy's actual losses fell inside the range the models already carried for a major Northeast event.
Swiss Re's own post-event review backs this up. Using 113 years of U.S. hurricane history, it estimated a loss of Sandy's size would be expected roughly once every eight years; adjusted for the active multidecadal warm phase the Atlantic was in, it put the return period below five years nationally. In the Northeast specifically, Sandy ranked second only to the 1938 Long Island Express (Swiss Re). Regionally, modelers put the NY/NJ return period at 80-90 years; nationally, Sandy was closer to a 1-in-10-year hurricane (Mildenhall). Rare for the region. Ordinary for the country.
Where Swiss Re said the industry actually fell short: storm surge exposure data quality, and the deductible-trigger ambiguity created when a storm weakens to "post-tropical" just before landfall. Those are real gaps. Neither one is "the model didn't see Sandy coming." The model saw a storm like Sandy coming. The industry's surge data and its deductible language didn't.
The Northeast can get a monster storm
That's the lesson that should have outlasted the news cycle. The Northeast is not a low-severity hurricane market just because major hurricanes rarely make landfall there. It is a market where an infrequent event can produce surge and flood losses on the scale of a Gulf Coast hurricane, concentrated in some of the most valuable, most densely built coastline in the country.
Thirteen years later, that exposure hasn't shrunk. It has grown.
What Sandy would cost today
Academic researchers have already done part of this math. A hurricane-normalization study published in the Bulletin of the American Meteorological Society (Muller, Bowen, Klotzbach et al., January 2025) adjusts Sandy's actual damage for inflation, wealth, and population and housing growth in the counties it hit, and puts total economic damage, public and private, insured and uninsured, wind and flood combined, at roughly $104 billion in 2022 terms. That ranks Sandy 8th to 9th costliest hurricane in U.S. history. It's not a modeled insured-loss figure and it carries no wind/flood split, but it confirms the direction: exposure in Sandy's footprint has grown sharply since 2012. NYC's own floodplain property value rose 44% from 2012 to 2022 alone, and Jersey Shore home prices are up roughly 75% over the same stretch, even as NFIP flood policy counts in New Jersey fell 15%, meaning more of a repeat loss would land outside the safety net entirely.
For the insured side, the 2012 split is the place to start. Wind accounted for an estimated 30-40% of private insured losses, call it $6-8 billion of the $18.75 billion PCS total, with flood and surge driving the rest.
Modeling and consulting firm Karen Clark & Company (KCC) estimates losses from another Sandy-like event, at roughly $31 billion in insured loss on 2026 industry exposure (wind and surge together): $21 billion from wind and $10 billion from storm surge (KCC correspondence, October 2026). For surge, KCC assumes the auto line is fully insured and that commercial, residential, and industrial property lines to have roughly 10% takeup/coverage. This estimate also credits building code improvements made since 2012. Because so little property carries surge coverage, the insured figure is a fraction of the damage: KCC puts overall flood damage, insured and uninsured, at around $100 billion if Sandy occurred today.
The storm does not need to get any worse to get more expensive. The exposure sitting underneath it already has.
What this means for carriers and reinsurers
Surge and inland flood are still the most underpriced perils in the Northeast relative to their loss potential, in large part because the region's hurricane history is thin enough that "it hasn't happened here" still gets mistaken for "it can't happen here." Sandy's own numbers argue against that: the models had the range right before the storm ever formed.
The second lesson is about contract language, not pricing. A storm doesn't have to stay classified as a hurricane all the way to the beach to produce hurricane-scale losses, and percentage deductibles, named-storm triggers, and other definitional tripwires written around the word "hurricane" can fail at exactly the moment they're needed most. Sandy proved that once. The Northeast's growing coastal exposure guarantees it gets tested again.
Sourcing note
All figures above were pulled and cross-checked against primary sources on 2026-10-16, citing NOAA NCEI, the NHC's official Tropical Cyclone Report, Triple-I/PCS, Swiss Re, Munich Re, RMS (via Artemis), Crawford & Company, and a practitioner compilation of modeler estimates (Stephen Mildenhall). A few caveats worth knowing before this goes further:
- NOAA retired the Billion-Dollar Disasters database in 2025; its Sandy figure is now final and won't be revised.
- "Insured loss" means different things by source: PCS excludes NFIP, Swiss Re and Munich Re include it. The $18.75B and $8.967B figures above are kept separate for that reason.
- The Swiss Re quotes trace to a third-party hosted copy of its 2012 catastrophe report, not swissre.com directly; worth a direct-source check before publication.
- No authoritative published comparison of Sandy's actual loss to modeled average annual loss (AAL) was found; that comparison was deliberately left out rather than estimated.
- The KCC figures come from correspondence with Karen Clark & Company in October 2026 and have not been published. Its surge estimate assumes the auto line is fully insured for surge and that roughly 10% of commercial, residential, and industrial property is.

About the author: David Delaney
David Delaney is President & CEO of Insight Analytics, an insurance analytics and underwriting technology company focused on real-time underwriting insights and catastrophe risk analytics. He has more than 25 years of experience across insurance, reinsurance and InsurTech, and previously held Vice President roles in catastrophe risk management and catastrophe underwriting at AIG. Connect on LinkedIn.